
Every stock market era has its own “chosen ones” – the narrow group of shares on which institutional investors, analysts and the media seem to focus almost simultaneously. Behind them there is usually genuine fundamental strength, even if market sentiment occasionally pushes share prices far beyond reasonable levels. Across modern stock market history, these leading groups have changed again and again, yet the pattern has remained surprisingly consistent.
A chart that shows the bigger picture
Before looking at each era in detail, it is worth viewing stock market history from a step back. One widely cited chart from Bank of America Global Research does exactly that: it shows how major waves of market concentration have repeatedly been followed by a peak and then a decline.
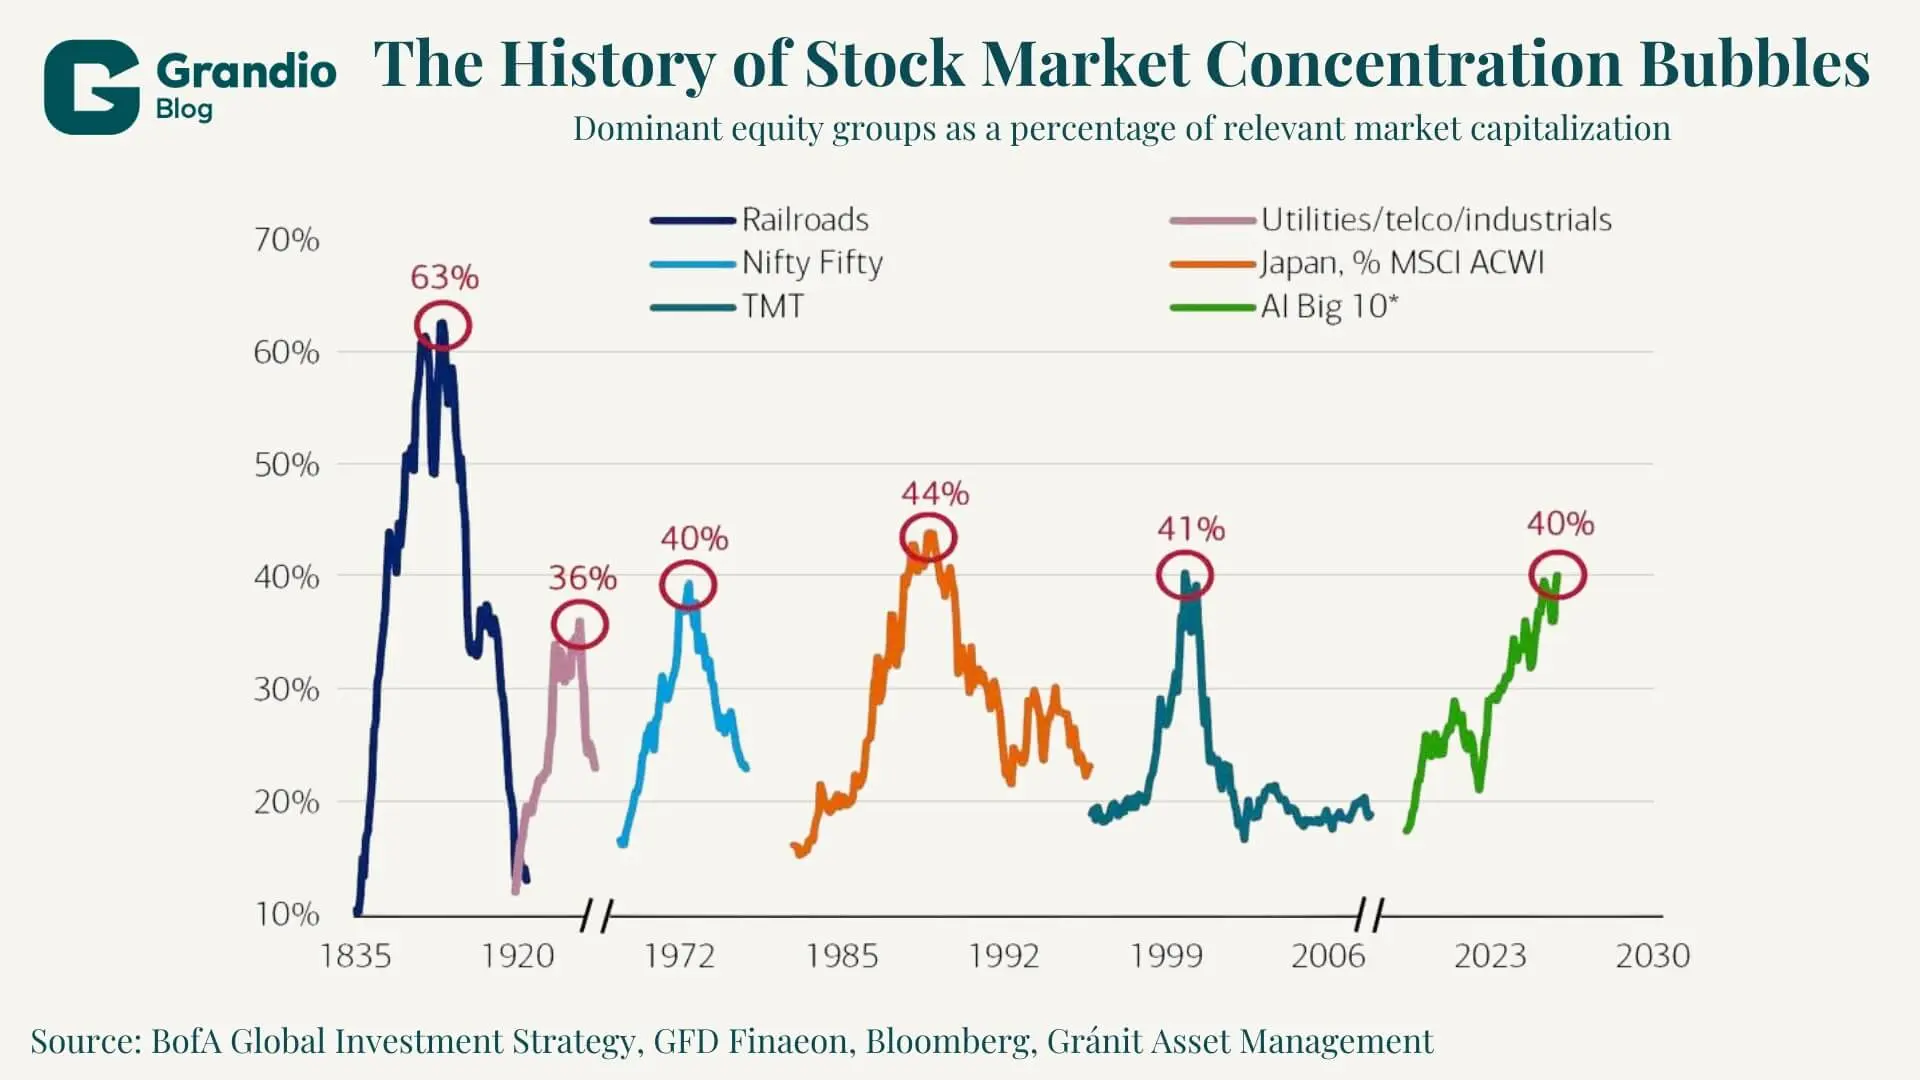
The chart shows the weight of each era’s dominant equity group as a share of US equity market capitalization – or, in the case of Japan, as a share of the global MSCI ACWI market capitalization:
Railroads, 1835–1920: the infrastructure boom of the late 19th century lifted the weight of railroad companies in the US market to a peak of 63 percent – the highest concentration shown in the chart.
Utilities, telecommunications and industrial companies, 1920s: the next wave peaked at 36 percent, built on post-First World War economic optimism and the spread of electricity.
Nifty Fifty, 1972: blue-chip growth stocks increased their weight to 40 percent before the oil crisis and stagflation dismantled their premium.
Japanese equities in the MSCI ACWI, 1989: at the peak of the Japanese bubble, Japan represented 44 percent of global equity market capitalization – a figure that has since fallen below 6 percent.
TMT – technology, media and telecommunications, 1999–2000: the dot-com bubble reached a peak of 41 percent before the legendary collapse followed.
AI Big 10, 2023–present: according to the chart, the “AI Big 10” group – made up of the Magnificent Seven plus Broadcom, AMD and Micron – had once again reached a concentration level of 40 percent by 2026. In other words, it is broadly back in the historical range where several previous bubbles also peaked.
In the earlier periods shown, when a group of stocks reached a concentration level of 40–44 percent, a significant decline eventually followed. This does not mean that the AI rally will end tomorrow, but the historical analogy is difficult to ignore.
In financial-market shorthand, however, these eras often live on through the names that became attached to particular groups of stocks. It is therefore worth starting with some of these famous groups. They do not all map neatly onto the categories in the chart, but together they show how the market’s seemingly “must-own” leaders are born, gather momentum and eventually evolve.
The first stars: the Nifty Fifty
The first truly legendary group of stocks was the so-called Nifty Fifty: roughly fifty blue-chip growth stocks that institutional investors regarded, from the late 1960s to the 1972 peak, as suitable to “buy and hold forever”. The list was never official, but Coca-Cola, IBM, Johnson & Johnson, McDonald’s and Pfizer were regularly included.
The name came from Wall Street slang. The English adjective “nifty” broadly means clever, excellent or smart. It was not created by a stock exchange body or as an acronym – it simply reflected the investor belief that these were good stocks to own.
What was truly striking was the valuation. At the end of 1972, Nifty Fifty stocks traded at an average P/E ratio of 42, while the broader S&P 500 stood at just 19 times earnings. The “buy and never sell” narrative, however, fell apart in 1973–74: the oil crisis and stagflation swept away the group’s valuation premium. Yet the long-term lesson is more nuanced. According to research by Howard Marks and Jeremy Siegel, roughly half of the group still generated respectable returns over several decades even if bought at the pre-crash highs – and Coca-Cola and Johnson & Johnson remain market leaders today.
There is a shared name, but no family relationship. Today, “Nifty Fifty” – more precisely, the NIFTY 50 – is also the official name of the leading equity index of India’s National Stock Exchange, the NSE. It was launched in 1996 through a deliberate combination of the words “National” and “Fifty”. The Indian index tracks the country’s 50 largest listed companies – including Reliance Industries, HDFC Bank and Infosys – and serves as the primary benchmark for India’s equity market. The two names were born from entirely different logics: the American version from Wall Street slang, the Indian version from acronym-building. Yet the end result is similar: fifty stocks that became a symbol of their era’s market spirit.
The oil aristocrats: the Seven Sisters
Around the same period, but according to a completely different logic, the global oil market was dominated by the seven companies known as the Seven Sisters: Anglo-Persian Oil Company, the predecessor of today’s BP; Gulf Oil; Standard Oil of California, the predecessor of today’s Chevron; Texaco; Royal Dutch Shell; Standard Oil of New Jersey, later Exxon; and Standard Oil Company of New York, later Mobil. Enrico Mattei, the founder of the Italian oil company ENI, popularized the name, referring to the fact that before the 1973 oil crisis the seven companies controlled roughly 85 percent of the world’s petroleum reserves.
This group drew its strength not from investor hype, but from genuine industry dominance. The 1973 oil crisis and the rise of OPEC then brought their dominance to an end. Today, the phrase “new Seven Sisters” usually refers to mostly state-owned oil companies from outside the OECD: Saudi Aramco, Gazprom, CNPC, NIOC, PDVSA, Petrobras and Petronas.
The champions of the PC era: the Four Horsemen
The technology boom of the 1990s brought the first truly technology-led leadership group, which the financial press called the Four Horsemen. The quartet consisted of Microsoft, Intel, Cisco and Dell. Together, they provided almost the entire infrastructure of the personal-computing ecosystem.
After the turn of the millennium, however, the internet bubble dragged down their shares as well. Intel and Cisco have still not regained their 2000 peaks in relative terms, Dell’s stock market journey took a separate path, and only Microsoft found a route to renewal through cloud services. The story of the Four Horsemen is a useful precedent for what should also be considered today in relation to the Magnificent Seven: the members of a leading group do not have equal chances of surviving the next change of era.
The age of internet platforms: FANG, FAANG, FAAMG
The modern acronym era began in 2013, when Jim Cramer, host of CNBC’s Mad Money, popularized the FANG abbreviation: Facebook, Amazon, Netflix and Google. At the time, the four companies represented the restructuring power of digital advertising, e-commerce and video streaming.
In 2017, the inclusion of Apple broadened the group into FAANG. In 2014, FAANG stocks represented only 7.4 percent of the S&P 500’s market capitalization; by 2019, that figure had risen to 14.4 percent. When Microsoft’s cloud-led renewal returned the company to the ranks of the most influential technology giants, the FAAMG label gained currency in analyst and institutional usage: Facebook, Apple, Amazon, Microsoft and Google – with Microsoft effectively taking Netflix’s place.
In 2021, after Facebook became Meta and Google’s 2015 parent-company structure under Alphabet had become embedded in market usage, Jim Cramer reorganized the group as MAMAA: Meta, Apple, Microsoft, Amazon and Alphabet.
The current leading group: the Magnificent Seven
In 2023, Michael Hartnett, a strategist at Bank of America, named the new elite club the Magnificent Seven, after the 1960 Western classic: Apple, Microsoft, Alphabet, Amazon, Meta, Nvidia and Tesla. The change in name also signalled a change in substance. Compared with MAMAA/FAAMG, the list added two new players: Nvidia, the king of AI chips, and Tesla, which in the investor narrative is no longer merely an electric-vehicle manufacturer, but one of the most important listed expressions of Elon Musk’s future vision built around autonomous driving, robotaxis, robotics and artificial intelligence.
The numbers are impressive. In 2023, the Magnificent Seven collectively rose by roughly 76 percent, and these seven stocks accounted for more than half of the S&P 500’s annual gains. Their weight within the S&P 500’s market capitalization increased from 12 percent in 2015 to 34.3 percent by the end of 2025, and exceeded 35 percent by the spring of 2026. The “AI Big 10” shown in the BofA chart – the Magnificent Seven plus Broadcom, AMD and Micron – together are already approaching the 40 percent concentration level. This is broadly the same range in which the Nifty Fifty, the Japanese bubble and the dot-com bubble previously peaked.
What may come next?
The historical parallel does not necessarily imply an immediate collapse. In the case of the railroads, concentration persisted for decades, while the Japanese bubble deflated slowly but painfully. Some analysts envision a narrower group of “AI Horsemen” – led by Nvidia, Microsoft and a handful of chipmakers – while others expect a turning point to come from a broadening of the rally.
One of the most reliable lessons of stock market history, however, is that the current leadership group always eventually gives way to a new one. The only question is which members of the Magnificent Seven will remain era-spanning market leaders – and which will ultimately be remembered as emblematic winners of a historic market peak.
Legal Disclaimer
This document has been prepared by Gránit Alapkezelő Zrt. (registered office: 1134 Budapest, Váci út 17; company registration number: 01-10-046307) for marketing and informational purposes. Accordingly, it has not been produced in accordance with legal requirements designed to promote the independence of investment research. Nor is it subject to any prohibition on dealing ahead of the dissemination of investment research. This document does not constitute investment research or investment advice. Any data presented refers to past performance, and past performance is not a reliable indicator of future results. Each investor must make investment decisions at their own discretion and responsibility.